Gas prices are doing that thing again. You know, the financial equivalent of saying “I’m fine” while everything is clearly not fine.
And here’s the real problem: most businesses aren’t reacting late because they don’t have data. Oh no, there’s plenty of data. Charts, dashboards, expert commentary… enough to make your eyes glaze over.
They’re reacting late because they don’t have context.
One week, the headlines are basically: “Relax, prices are falling.”
Next week: “Panic, supply is tight.”
Very helpful, right?
Without a way to understand how both of those can be true at the same time, you’re left guessing:
Do you lock in a contract now?
Sit tight and hope prices drop?
Or try to hedge and pray you don’t regret it later?
That’s exactly where most businesses get stuck.
This guide exists to fix that.
Because right now, through 2025 and into 2026, the gas market isn’t just “moving.” It’s being reshaped by three big forces all hitting at once:
- A surge in global LNG supply (more ships, more gas, more movement)
- A tug-of-war in demand between Europe and Asia
- A tighter balance between what’s in storage and what the market actually needs
According to insights from the International Energy Agency, the European Commission, and analysts like Baringa Partners, one thing is crystal clear:
This is no longer a local or even regional market.
It’s a fully connected global system.
Which means what happens in one part of the world doesn’t stay there, it shows up in your energy bill.
That’s why prices can drop even when risks are quietly building.
And why they can spike even when supply looks perfectly fine on paper.
Confusing? Yes.
Random? Not at all.
In this article, we’re going to connect the dots without the jargon overload.
We’ll break down LNG flows, storage levels, weather risks, and geopolitical shifts into something that actually makes sense.
More importantly, we’ll translate all of that into what you really care about:
- When prices are likely to soften
- When volatility is about to make a comeback
- How to position yourself before the market moves, not after it punches you in the face
If you’re responsible for energy decisions, this isn’t just helpful context.
It’s your unfair advantage.
What Is the Wholesale Gas Market, and Why Should You Care About It?
The wholesale gas market is where suppliers, traders, and large buyers purchase natural gas before it ever reaches homes or businesses. Prices are set at major trading hubs: the UK’s National Balancing Point (NBP), Europe’s Title Transfer Facility (TTF), and the US-based Henry Hub.
Unlike retail tariffs, which are often fixed or regulated, wholesale prices move daily and sometimes hourly. They react instantly to supply disruptions, cold snaps, falling storage levels, and geopolitical events. That volatility does not stay in the wholesale market forever. It feeds through to contract renewals and pricing offers, especially for businesses.
How the Market Actually Works
At its core, the gas market operates across three layers.
The spot market handles same-day and intraday trading, where gas is bought for immediate delivery. This is where the sharpest price swings occur. The day-ahead market is where traders lock in gas for the following day based on demand forecasts tied to weather and power generation needs. And the forward market is where contracts are agreed upon months or even years ahead. This is where most businesses interact with the market, fixing prices to manage risk.
Here is what most people miss: even when you fix a contract, your supplier is pricing it against the forward wholesale market, which never stops moving.
Wholesale Prices vs. Retail Prices
Wholesale prices are raw, volatile, and market-driven. There are no caps and no smoothing mechanisms. Retail prices include supplier margins, network costs, and, for households, regulatory protections that delay and soften price shocks.
For businesses, that protection does not exist.
If wholesale gas rises 40%, a business feels it almost immediately at renewal. Contract offers can be withdrawn or repriced within days. Households, by contrast, benefit from Ofgem’s price cap, which delays and limits that exposure. This is why timing matters far more in commercial energy buying than most businesses realize until they have already missed the window.
NBP, TTF, Henry Hub: Which Benchmark Actually Matters to You?
Each hub reflects a different regional dynamic. The NBP is the UK’s main pricing point and one of the most volatile in Europe. The TTF is Europe’s largest, most liquid gas hub and the continental benchmark. Henry Hub in the US is comparatively stable, supported by abundant domestic supply and lower exposure to global competition.
The reason the UK market is structurally more volatile than continental Europe comes down to one thing: storage. The UK holds roughly 10 days of gas demand in storage. Germany can hold around 90 days. That asymmetry means the UK depends on real-time imports and LNG deliveries in a way that Germany simply does not. When supply tightens or demand spikes, NBP prices react faster and more aggressively than TTF. That is not a temporary feature of the market; it is a permanent structural constraint.
Where Did Gas Prices Stand Coming Into 2025, and What Changed?
After the shock of the 2022 global energy crisis, wholesale prices spent most of 2023 and 2024 stabilizing. Storage was rebuilt, demand softened, and markets gradually cooled from their extreme highs.
But 2025 did not follow the smooth recovery many expected.
Prices came back under pressure in early 2025 as multiple structural issues resurfaced simultaneously: tighter European storage levels, reduced Russian pipeline flows, and slower-than-expected LNG supply growth. That combination pushed TTF higher in Q1 2025 before easing again in Q2 as supply improved and demand weakened.
The important takeaway is that the market did not return to normal. It moved into a more fragile equilibrium, one where even small disruptions are enough to trigger meaningful price swings.
Why H1 2025 Saw Higher-Than-Expected Prices
Three factors explain the early pressure. Global LNG output did not ramp up quickly enough in early 2025, limiting flexibility just when Europe needed it. Storage levels were lower than the previous year, reducing the buffer available for demand spikes. And Russian pipeline gas, once a major and cheap supply source, kept declining.
The result was a market that did not need a crisis to see prices rise; it just needed less margin for error. And in early 2025, there was very little of that.
The UK-Specific Picture
While Europe experienced broad volatility, the UK market followed a slightly different path. NBP prices reached 81.59 pence per therm in October 2025, roughly 17% lower year-on-year. That partial recovery is real, but UK prices remained highly reactive to short-term supply changes throughout, and limited storage kept volatility elevated well above continental European levels.
The Russian Pipeline Divorce
One of the biggest structural shifts in the market is the ongoing separation between Europe and Russian pipeline supply. Data from the Agency for the Cooperation of Energy Regulators shows that Russian piped gas to the EU fell roughly 45% year-on-year in Q2 2025.
This is not a temporary disruption. It is a structural reset.
Europe has lost a major source of low-cost, reliable pipeline gas. Supply has shifted toward global LNG markets, and pricing is now exposed to international competition in a way it never was when Russian gas dominated European supply. In plain terms, Europe moved from a pipeline-based system to a global bidding market. That shift is a primary reason why volatility persists even when overall supply looks stable.
Why Europe’s Storage Problem Did Not Go Away
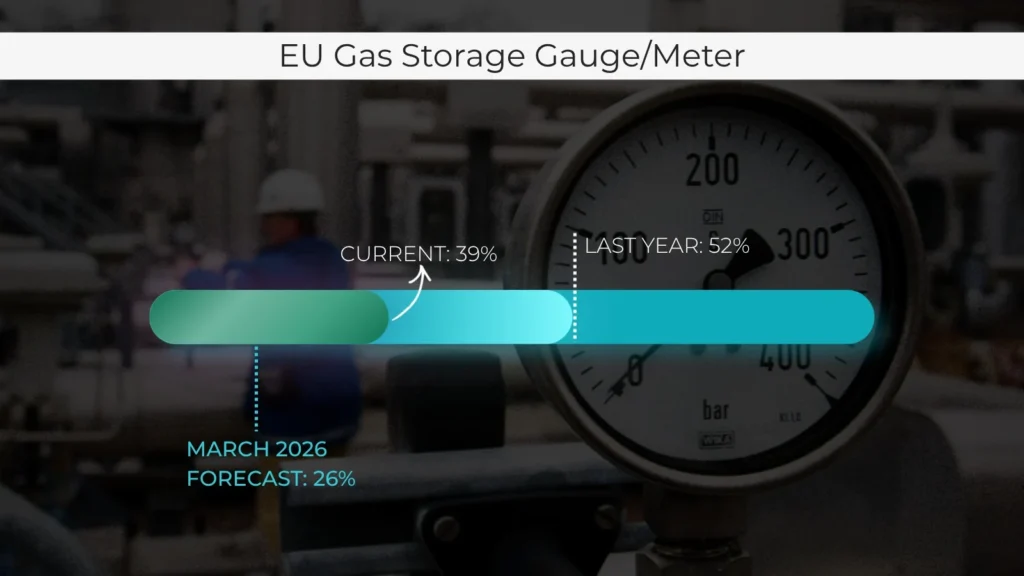
Storage has been the hidden driver behind many of 2025’s price movements. Entering winter 2025/26, EU storage sat at roughly 39% capacity, compared to around 52% the previous year. At the country level, Germany stood at 30.2%, France at 29%, and the Netherlands at 23.5%.
These are not crisis levels, but they are significantly tighter than anything Europe has managed in recent years, and the consequences are real. Lower storage means less buffer during cold weather, greater reliance on imports, and faster price reactions when supply is disrupted.
The pressure does not end in winter either. With storage forecast to drop to around 26% by March 2026, Europe faces strong demand for summer refilling. Even if winter prices ease, summer prices stay supported because Europe has to aggressively replenish what it burned through. Buyers who assume prices simply fall once winter passes tend to learn this lesson the hard way.
The LNG Wave: The Biggest Force Reshaping the Market
A surge in global LNG supply is the single most important structural shift heading into 2026.
After years of constrained capacity, new export infrastructure from the United States, Canada, and Qatar is finally coming online at scale. Global LNG supply is projected to grow by around 7% in 2026, the fastest expansion since 2019. This wave is expected to ease supply pressure, push European prices lower, and connect regional gas markets more tightly than at any point in history.
But it also introduces a new reality: prices are no longer a regional story. They are global and competitive.
Why 2026 Is a Turning Point
Several major LNG projects are hitting the market almost simultaneously. In the United States, Plaquemines LNG and Corpus Christi Stage 3 are following record export levels in 2025, cementing the US as the world’s leading LNG supplier. In Canada, LNG Canada is bringing new export capacity online for the first time, with direct access to Asian markets. In Qatar, the North Field East expansion is one of the largest LNG projects ever built, known for its low-cost production and long-term supply stability.
Taken together, these projects represent the first time since pre-pandemic years that supply growth is genuinely catching up with global demand expectations.
Will More LNG Actually Mean Lower Prices for UK Businesses?
Partially. But not reliably.
The IEA projects European gas prices could ease by around 10% in 2026 versus 2025, and that is a real supply effect. However, the UK’s limited storage and heavy reliance on imported LNG mean that NBP prices remain reactive to global disruptions even in a well-supplied market.
More supply reduces average prices over time. It does not eliminate the short-term spikes driven by demand competition, weather events, and shipping constraints. What the LNG wave actually delivers is lower price floors with continued volatility around them.
For buyers, this matters because it shifts the strategy. The question is no longer just whether prices are high or low; it is whether you are positioned to capture downward moves and insulated against the spikes that will still come.
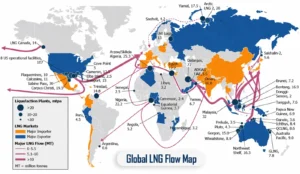
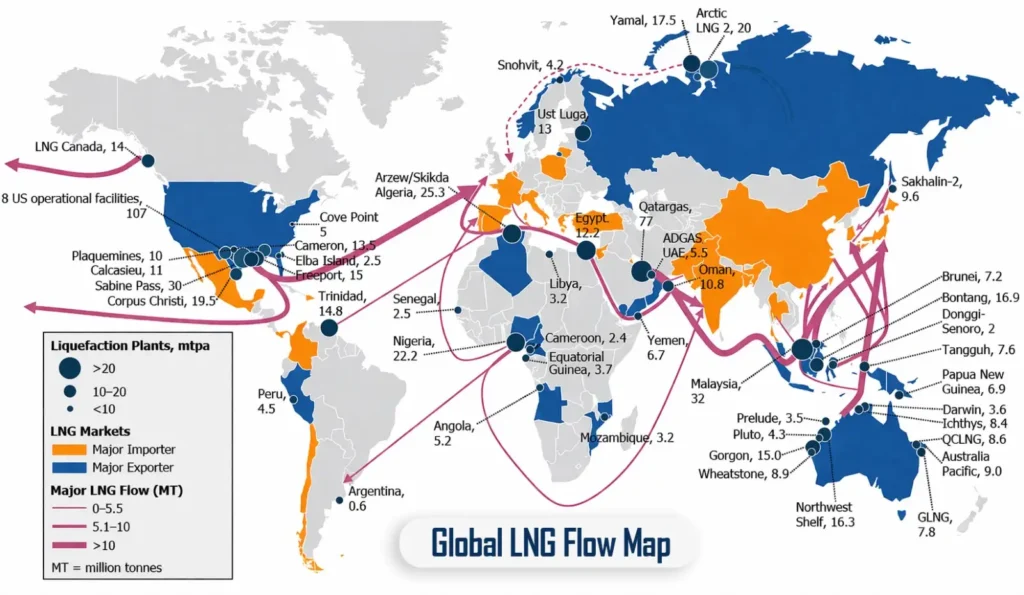
How LNG Arbitrage Shapes UK Prices
LNG does not stay in one region. It flows to wherever prices are highest. When Asia pays more than Europe, cargoes go east. When Europe outbids Asia, cargoes come west. The UK sits at the end of this chain, relying on cargoes that could always be redirected elsewhere.
What this means in practice is that UK prices are not just a function of UK supply and demand. They are a function of what China, Japan, and South Korea are willing to pay at the same time. A heatwave in Asia can raise UK gas prices. A US export outage can tighten European supply. A mild European winter can lower global LNG demand and, with it, prices.
This is a fully interconnected global system, and businesses that treat it as a local market tend to be caught off guard when global events move their energy costs.
The Five Forces Driving Prices Into 2026
Wholesale gas prices in 2025/26 are not being shaped by any single factor. Five overlapping forces interact with each other in real time, and understanding how they relate is what separates reactive energy buying from strategic procurement.
Geopolitical risk now carries a permanent premium built into global gas prices. Middle East tensions affect LNG shipping routes. Russian flow restructuring continues to reshape European supply. Even the credible risk of disruption moves prices before any actual supply loss occurs.
Weather remains the fastest-moving trigger. Winter Storm Fern in early 2025 caused one of the largest US gas storage withdrawals on record, tightening LNG export availability at exactly the moment Europe needed supply. A single cold event in one region can raise costs in another within days.
Storage pressure shapes pricing well beyond winter. Europe entered 2025/26 with lower-than-usual inventories, and summer refilling demand keeps prices supported even in months when heating needs are minimal. Buyers who wait for winter to think about gas contracts often find summer prices less attractive than they expected.
LNG cargo competition between Asia and Europe is now a constant feature of the market. When Asian demand rises, cargoes divert east. European supply tightens. NBP prices respond quickly and sharply.
Renewable output adds a layer of volatility that did not exist a decade ago. Gas is now the backup fuel for wind and solar. When wind drops, gas-fired power demand rises and prices follow. When wind is strong, demand softens. This creates price swings tied to weather patterns that have nothing to do with industrial gas demand.
One factor that often gets overlooked: exchange rates. LNG is globally priced in US dollars. A weaker pound means higher import costs for UK buyers, even if global prices are flat. Currency movements can quietly add cost to a contract without any change in the underlying market.
Where Are Prices Heading in 2026? What the Forecasts Say
The headline consensus points to moderating, but not collapsing, prices.
US Henry Hub is expected to average around $3.80 per MMBtu in 2026, slightly lower than earlier forecasts following a milder February but still elevated versus pre-2021 norms. European TTF is forecast to ease roughly 10% compared to 2025. On the domestic side, Ofgem’s price cap is expected to fall around 7% from April 2026, bringing the household gas unit rate to approximately 5.7 pence per kWh.
The important qualification is that every major forecaster, including the IEA, EIA, and World Bank, explicitly flags geopolitics, weather, and storage constraints as material risks capable of invalidating the baseline quickly.
What Forward Markets Are Signalling
European gas contracts for 2026 are currently averaging around 32 to 36 euros per MWh, below the peaks seen in H1 2025. But the spread between summer and winter contracts is unusually wide, reflecting continued sensitivity to weather and demand uncertainty.
For buyers, that spread is a useful signal. It tells you the market expects seasonal volatility to remain elevated even as the annual average price trends lower.
Scenarios That Could Break the Baseline
Four scenarios carry genuine potential to push prices well above the moderate baseline.
A sustained closure of the Strait of Hormuz would restrict global LNG flows and feed directly into European and UK prices. A colder-than-normal winter in Europe or the US would drain storage faster than expected. China re-entering the LNG market aggressively in 2026 would drive direct cargo competition with European buyers. And a cold spring slowing summer storage refilling would carry the supply squeeze into winter 2026/27.
None of these are certainties. But any one of them, or a combination, would move prices sharply and quickly. The IEA’s Q1-2026 report put it plainly: geopolitical tensions and weather impacts may still cause significant volatility even as LNG supply eases market tightness. The moderate-price narrative is conditional, not guaranteed.
How UK, European, and US Gas Prices Compare Right Now
The three major markets are diverging in ways that matter for anyone buying gas in the UK.
The US Henry Hub remains structurally the lowest, insulated by massive domestic production and direct proximity to new LNG export terminals. European TTF is easing from 2025 highs but remains elevated due to storage deficits and reduced Russian supply. The UK NBP sits between the two in absolute terms but carries a volatility premium that neither the US nor most of Europe experiences to the same degree.
The TTF-NBP spread is a market signal worth watching closely. When NBP trades at a premium to TTF, it almost always signals UK supply stress, whether from LNG cargoes diverted to Asia, low storage at UK terminals, or pipeline disruptions. Traders monitor this spread daily. Businesses would benefit from doing the same, especially in the months before a contract renewal.
What This Means for Your Business: Procurement That Actually Works
Wholesale trends are not abstract data points for energy economists. They flow directly into the cost of every commercial gas contract in the UK. Unlike household consumers, businesses have no regulatory buffer. Every movement in NBP or TTF prices eventually shows up in contract quotes, renewal offers, and out-of-contract rates.
The question is not whether this matters. It does. The question is whether your procurement approach is calibrated to the current environment or running on autopilot.
Fixed or Flexible in 2025/26?
Forward curves suggest prices easing through 2026, but the upside risks we have covered are real and not small. In that environment, pure fixed contracts bought at H1 2025 peaks risk looking expensive by mid-2026 if the easing scenario plays out. Flexible or blended contracts allow businesses to capture downward price moves while limiting exposure to sudden spikes.
The right answer depends on your risk tolerance, consumption patterns, and how much certainty your cash flow planning requires. There is no single correct approach, but there is a clearly wrong one: ignoring the market entirely until your renewal is already overdue.
The Cost of Doing Nothing
Many businesses roll onto out-of-contract rates by default, not out of strategy but out of inaction. Those deemed rates are typically 20 to 40% higher than the best negotiated contracts available at the same time. Doing nothing is still a pricing decision; it just tends to be the most expensive one available.
Reading the Market Before Your Renewal
A practical approach does not require becoming a gas trader. It requires monitoring a small number of indicators and having a decision trigger ready before your window opens.
Check the NBP forward curve for your renewal period. Monitor EU storage levels, which are a reliable leading indicator of price pressure. Track whether LNG cargoes are flowing toward Europe or Asia; when Asian demand rises, UK supply tightens. Set a target price with your broker and a trigger to act when the market reaches it. And prepare your contract paperwork in advance so that when the right moment arrives, you can move quickly rather than scrambling to catch up.
Policy, Energy Security, and the Long Game
The wholesale gas market is not shaped purely by supply and demand. Policy decisions at the national and EU levels are restructuring supply fundamentals in ways that will define prices well into the second half of the decade.
The EU’s commitment to phase out Russian pipeline gas by November 2027 is a long-term structural support for European prices. Even as LNG supply grows, removing Russian gas from the system increases Europe’s dependence on global imports and competitive bidding. Prices will not fall to US levels regardless of how much new LNG comes online.
In the UK, North Sea licensing, interconnector investment, and longer-term hydrogen pathways all contribute to energy security. These measures help buffer some supply shocks, but they do not solve the fundamental storage constraint that makes NBP more reactive than TTF.
Globally, over 90 billion cubic meters of new LNG capacity reached final investment decisions in 2025, according to the IEA. That investment will reshape supply architecture through the late 2020s. But it does not eliminate near-term volatility, and businesses planning strategy around hydrogen replacing gas for process heat before 2030 should treat that timeline with realistic skepticism. It is unlikely to be material at scale before then.
The Biggest Risks to Watch Through 2026
The consensus forecast is moderate. But the risk distribution is not symmetric. Upside risks to prices significantly outweigh downside risks, and the gap between a calm baseline and a stress scenario is unusually wide right now.
Geopolitical escalation, particularly any sustained disruption to Strait of Hormuz shipping, carries a medium probability but a very high price impact. Weather shocks carry a medium to high probability; a cold spring slowing storage refilling is a specific risk that tends to get underweighted in market narratives focused on winter. China’s LNG demand re-entry is a medium-probability, high-impact event that could redirect cargoes away from Europe faster than most models currently assume. Infrastructure risk from unplanned outages at Norwegian production or UK import terminals is a lower probability but capable of tightening supply sharply and quickly.
AI-driven data center growth is worth flagging as an emerging structural driver. Electricity-intensive computing is adding new demand for gas-fired power generation that was not in forecast models three years ago and is not yet fully priced into long-term supply projections.
The IEA’s Q1-2026 report was clear on the overall picture: geopolitical tensions and weather impacts may still cause significant price volatility even as LNG supply eases market tightness. The moderate-price story is a baseline, not a guarantee.
Frequently Asked Questions
What is driving wholesale gas prices in the UK in 2025?
Several factors converged at once. Lower Russian pipeline supplies to Europe, tight storage entering winter, slower LNG supply growth in the first half of the year, ongoing Middle East geopolitical pressure, and weather-driven demand spikes in both Europe and the US all pushed prices higher than the moderate recovery many analysts had forecast.
Will UK gas prices fall in 2026?
Forecasts point to moderate easing. European TTF is expected to be roughly 10% lower than 2025 levels, and the Ofgem household unit rate is forecast to drop to around 5.7 pence per kWh from April 2026. For commercial buyers, the picture depends heavily on contract timing and structure. Upside risks from weather, geopolitics, and Asian LNG demand mean these forecasts carry wider-than-usual uncertainty.
How does the global LNG supply increase affect business energy contracts?
Rising LNG supply reduces average price levels in Europe and the UK over the medium term. For businesses, this means contract quotes should generally trend lower through 2026 compared to 2025 peaks. However, LNG growth improves averages; it does not eliminate the short-term spikes that continue to occur when demand competition or supply disruptions hit.
What is the National Balancing Point (NBP)?
The NBP is the UK’s virtual trading hub for natural gas, where suppliers, traders, and large industrial buyers transact contracts. NBP prices serve as the benchmark for commercial gas contracts across the UK market, and they are more volatile than the equivalent European benchmark (TTF) because of the UK’s significantly smaller storage capacity.
When is the best time for a business to fix its gas contract?
There is no single correct answer, but fixing during periods when forward prices are low relative to recent history, and when seasonal winter premiums are already priced in, tends to offer better value than acting at the last minute. Monitoring the NBP forward curve three to six months before your renewal date and having a target price ready before that window opens is a more effective approach than waiting until the contract is about to expire.
Why does the UK pay more for gas than many continental European countries?
The core reason is storage. The UK holds roughly 10 days of gas demand in storage; Germany holds around 90 days. That means the UK depends on real-time imports and LNG deliveries to a degree that most of Europe does not. Heavy reliance on global LNG cargoes exposes NBP prices to international cargo competition, making UK prices more volatile and, on average, higher than many EU benchmarks.